This week in lab, we were assigned the task of looking at maps and evaluating them on how they were deigned. We also had to pick a well-designed map and a poorly designed map and evaluate them and give a synopsis on them. This allowed us to look at different maps and understand how they were designed and realize that not all maps are simple and meant for everyone to look at and understand.
Well-design map
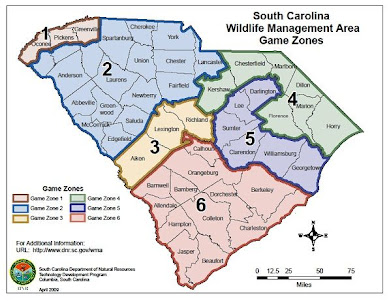 The South Carolina Wildlife Management Area Game Zones map is the perfect example of a well-designed map that any hunter, conservationist, wildlife agent, or high-school level person could easily understand. It has substantial information, minimizes map crap, and has an amazing layout. The map gives substantial information by labeling the counties in South Carolina, numbering, and color-coding the different zones. This makes the map super easy to understand and allows the viewer to quickly identify a specific county and the zone it falls under. I appreciate the numbered and color-coded zones, as they could act as an aid for colorblind individuals reading the map. Next, the map does not have “map crap”. The map is clear, straightforward, and free of unnecessary elements. Personally, I enjoy maps designed this way because they provide a calming effect, are easy to understand, and eliminates the stress of misinterpreting the overall message. Finally, the overall layout is very well balanced and has a very nice flow. This allows the viewer to locate everything without getting distracted by clutter. I appreciate how South Carolina is centrally positioned, creating a balanced and well-spaced layout. The only thing I would suggest is making the creation year more prominent, as it is currently small and placed at the bottom. I recommend adding the year to the title so viewers can easily determine whether the information is up-to-date.
Poor-Design Map
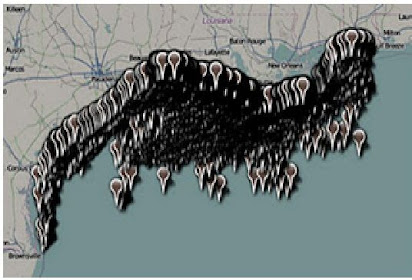 This map is very poorly designed. It lacks substantial information, doesn’t have effective labels, and poor overall layout. At first glance, this map screams chaos. All the viewer sees is a million points over a body of water and using context clues can assume it is the Gulf of Mexico. But what do these points represent? Why are they there? Who are they there for? What can this map of these points be used for? The lack of substantial information makes it extremely difficult to understand the main message of the map and leaves feelings of uncertainty. Which leads to using effective labels. The most effective label would be a title that helps the viewer understand what they are looking at. For example, “Location of Boating Accidents in the Gulf of Mexico Over the Last Five Years.” Effective labels would help the viewer understand the map, but they also need to have correct symbology. I would recommend sizing them down and using a smaller symbol or better icon to depict the points. Finally, the overall layout of this map is off balanced. The whole map takes up the entire page leaving no room for the essential map elements to aid the viewer. Depending on what the message of the map is, I would suggest using a very basic map of the Gulf of Mexico and coast line of the states, labeling the states and the gulf, adding smaller points, centering the map, and using the free space for the essential map elements.
Comments
Post a Comment