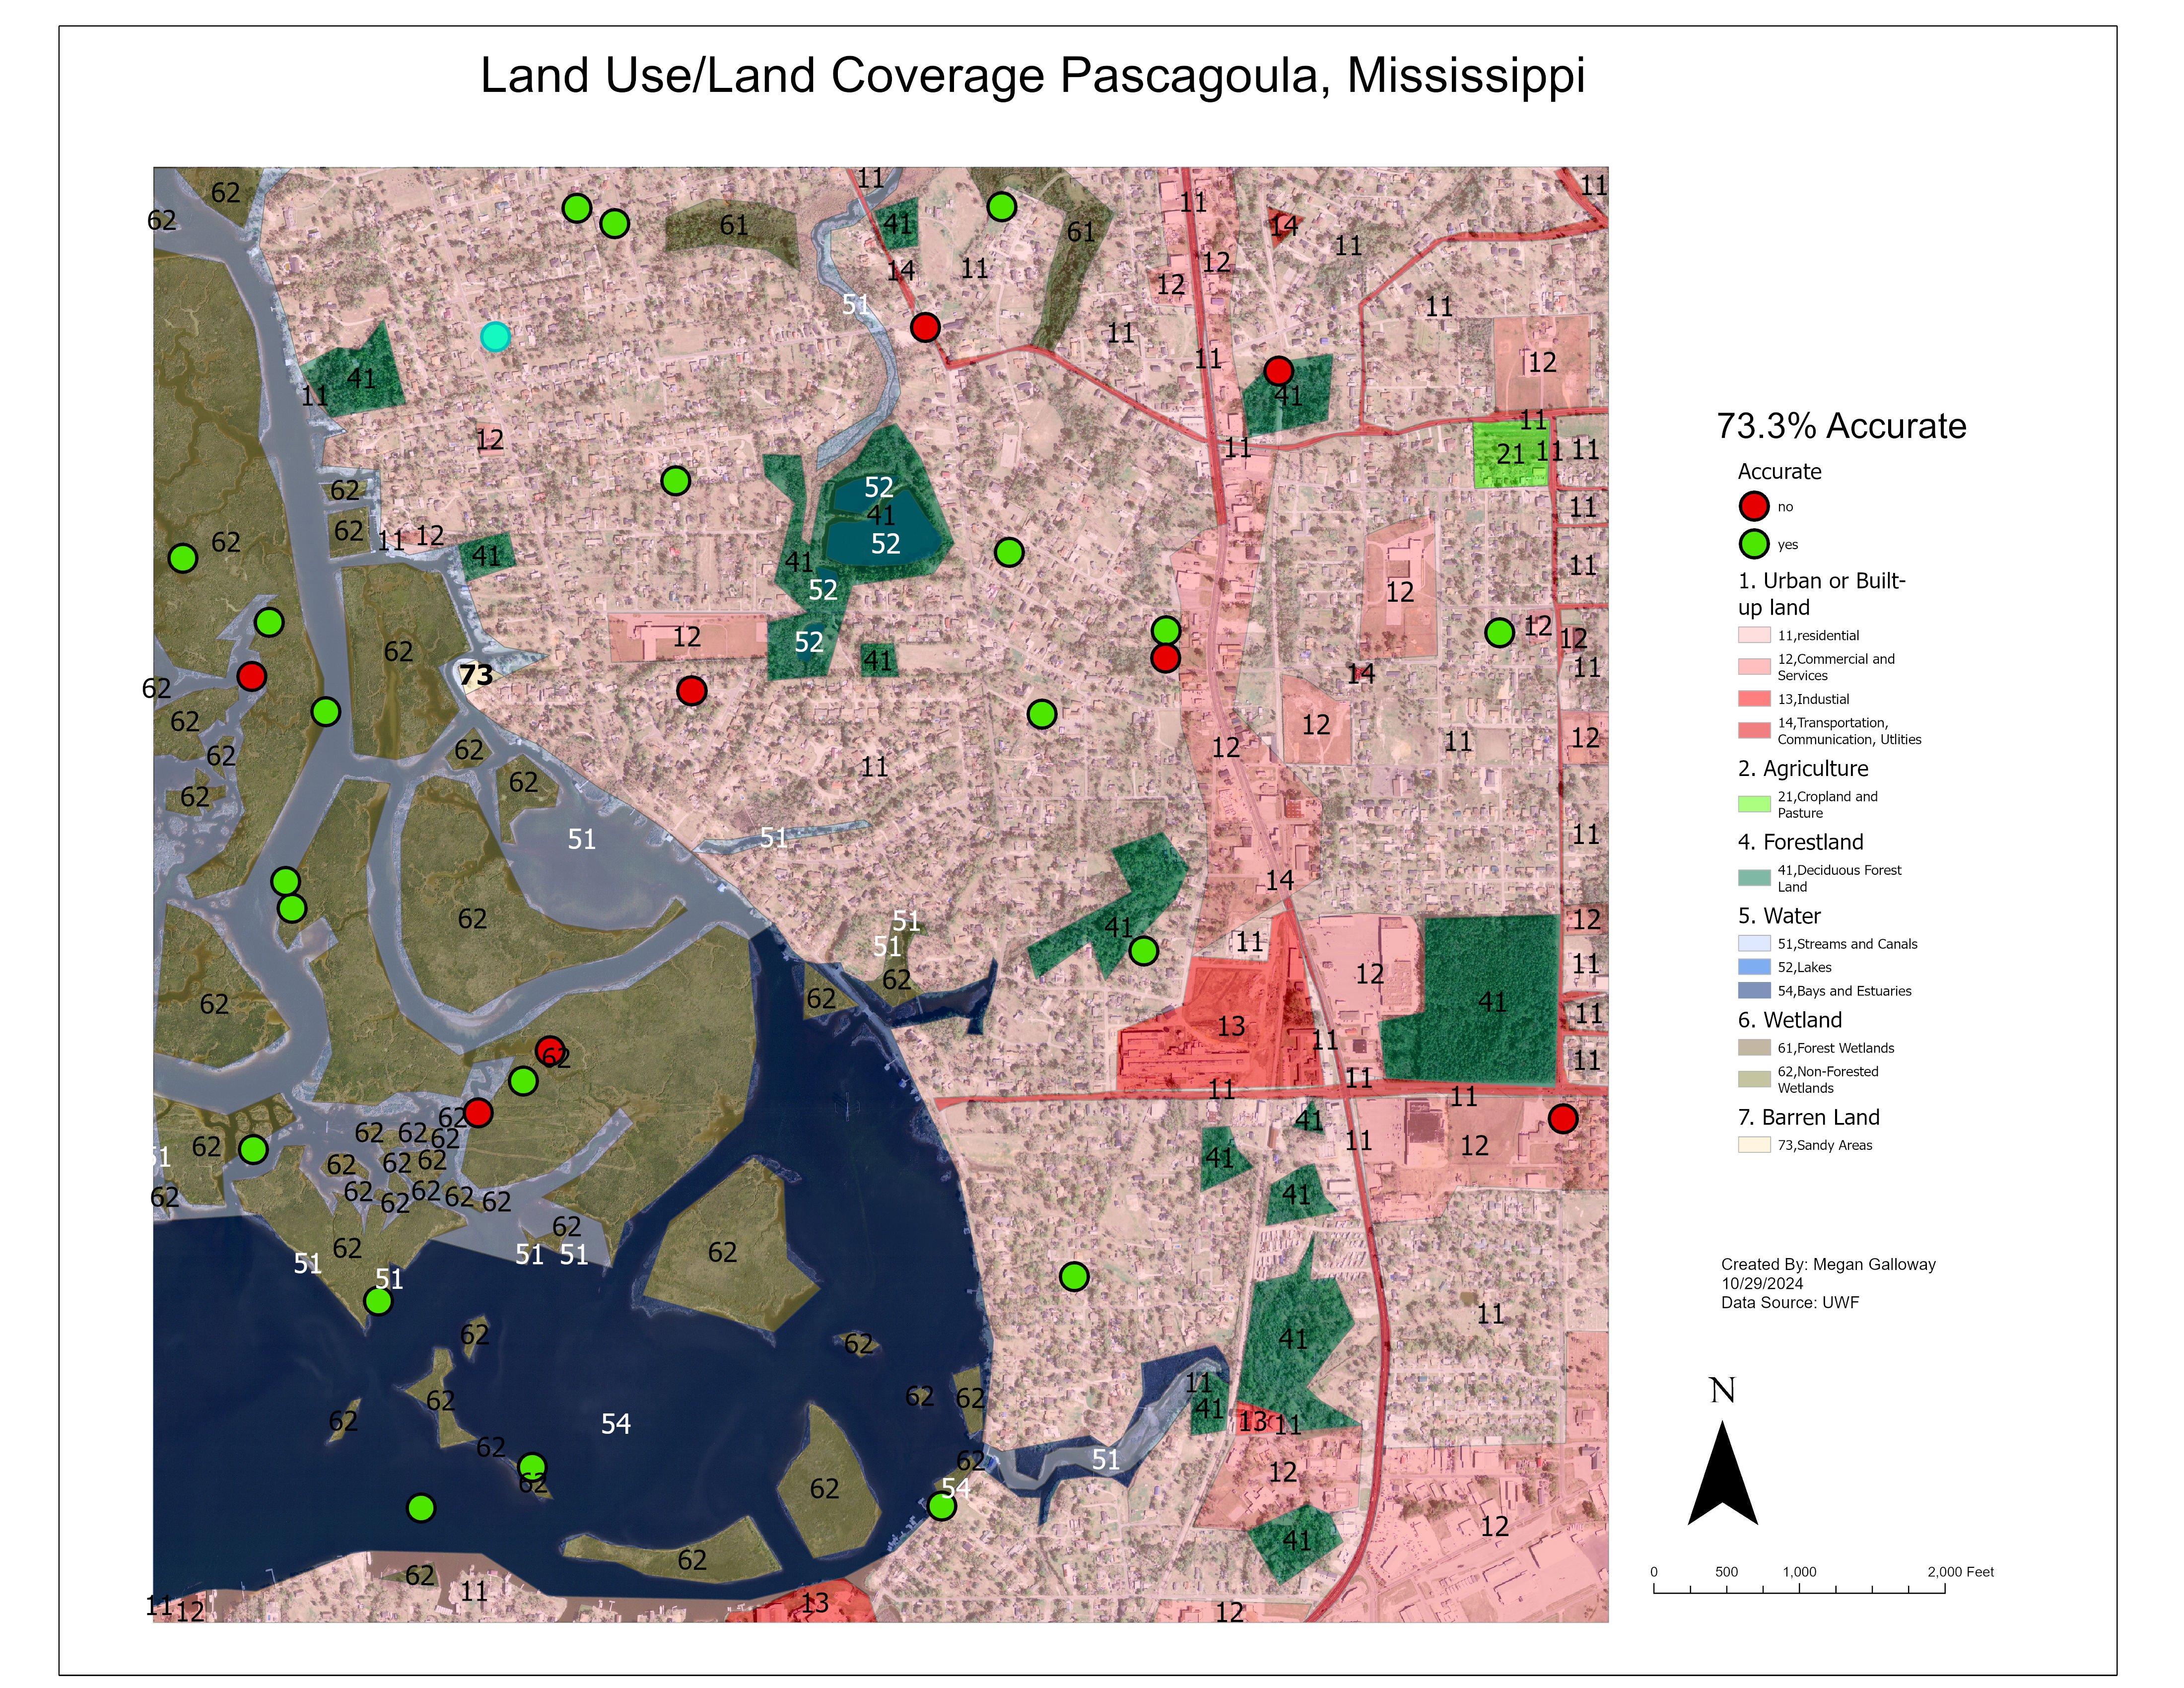
This week's lab defiantly got the best of me. It was very tedious and made you think, but I learned a lot from it. We were given an Ariel photo and created polygons based different classifications. The first level of classifications were 1. Urban or built-up land 2 agriculture, 4. forestland 5. water 6. wetlands 7. barren lands. Then, we had to go deeper and create sub categories. Finally, we had to create random sampling points and determine if they were true or false and how accurate we were. This lab took a lot of effort and it was my first time ever turning in an assignment late.

My first step in creating the map above, I created one big square polygon and split it without zooming in on the edge of the wetlands/water and the urban/ built-up land. Then, I zoomed in enough to see everything clearly, but not to much to distort the image and started creating polygons. This step took hours and I could have spent many more hours making it perfect, but I needed to get the assignment completed. Once I had all of my polygons created, I clipped them from my two original polygons and labeled them in the attribute table. Once my attribute table was completed, I merged all the polygons with the same code for symbology purpose and I added an additional column in my attribute table for main category. I exported the 6 main categories because I wanted to symbolize them based on their 1st and 2nd category. For example, for the water category, the three subcategories got a shade of blue. I also changed the transparency on the layers to 50% because the photograph should still be seen. Finally, I used the random sampling tool to give 30 random points and check their accuracy. I was about 73% accurate. The reason this number isn't higher is because I didn't digitize every road like I should of. I defiently could have spent way more time on this map and cleaned up edges and improved my accuracy.
Comments
Post a Comment